

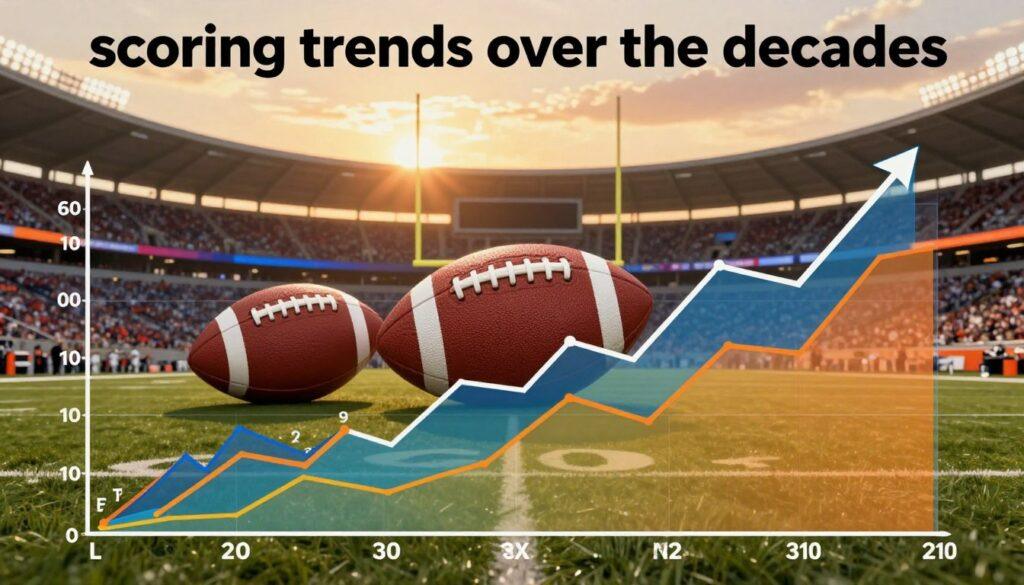
Let’s take a trip back in time. Imagine a wooden scoreboard, not a big screen. It’s 1918, and John Heisman’s Georgia Tech “Golden Tornado” is scoring an amazing 66.6 points per game. This record has stood for over a century, a true marvel.
This isn’t just football history. It’s a deep dive into the sport’s heart. We’re tracing the ups and downs of scoring like an economist tracks markets.
After 1912, rules changed, sparking a scoring boom. But then, defenses tightened in the ’20s and ’30s. Historical data shows that 24 points could top the nation back then.
As we move forward, we see a post-war surge and the ’80s renaissance. Now, we’re in a high-scoring era. Where do the Florida Gators stand in this journey?
Think of them as a stock that soared in the 2000s. Their offense didn’t just grow. It set a new standard. Looking at Florida football scoring stats from then shows a strategy so strong, it changed Vegas odds every week.
We’re linking old leather helmets to today’s tech-savvy players. Every point scored today is a result of choices made a century ago.
Scheme Changes
The old football offense was like a siege engine, but the spread is more like a drone strike. It wasn’t just a small change; it was a complete overhaul of the game. We moved from slow, plodding plays to a focus on quick, open spaces.
Coaches like Mike Leach and Urban Meyer were early adopters of this new approach. Leach’s Air Raid offense treated the field like a chessboard, always looking for the perfect play. Meyer and Chip Kelly, on the other hand, made this strategy their own.
Meyer believed that speed is a weapon, and space is a commodity. His Florida Gators were like algorithms on the field. Tim Tebow was more than just a runner or passer; he was the key to their system.
This led to points per game numbers that were unheard of. While others focused on defense, Meyer’s Gators used quick plays and option reads. Their championships in 2006 and 2008 showed the power of this approach.
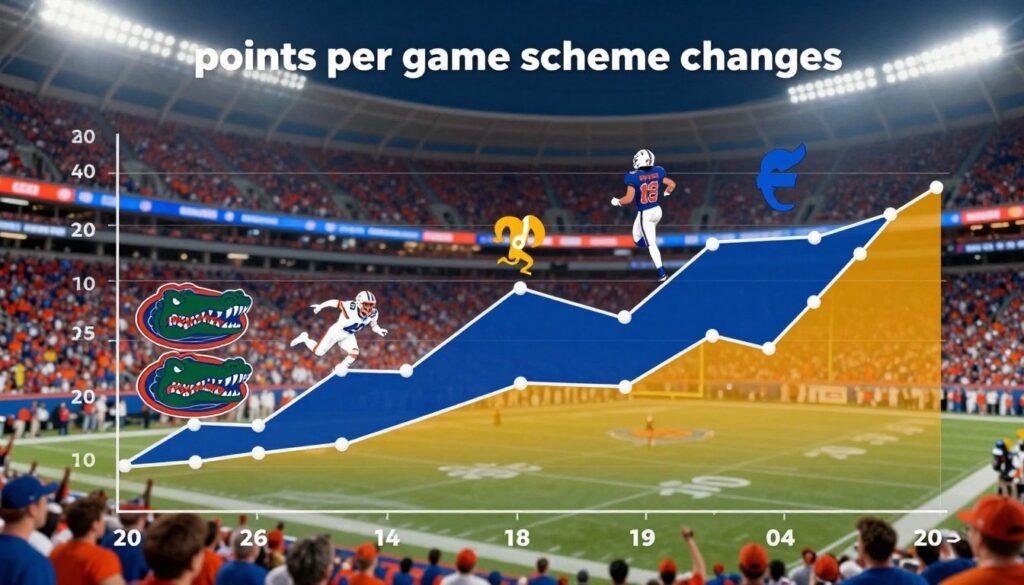
Chip Kelly at Oregon took the spread to the next level. He wanted to run 80 to 90 plays a game. It was a fast-paced game that left opponents exhausted.
Lincoln Riley at Oklahoma followed this trend. He had quarterbacks like Baker Mayfield and Kyler Murray, who could outsmart any defense. The Sooners’ offense became incredibly efficient, scoring lots of points.
This shift wasn’t about brute force; it was about strategy. Coaches used analytics to make smart decisions. This led to more points being scored.
The game’s rhythm changed dramatically. Defenses couldn’t just punt anymore; they had to face the offense again quickly. This led to more plays and more chances to score.
Coaches couldn’t just recruit big players anymore. They needed players who could think fast. The spread offense changed the game, making it faster and more strategic.
Effects of Rules/Coaching
Every spike in points per game has two main causes: new rules and coaching changes. If you think scoring trends over the decades are just about faster athletes, you’re wrong. The real game changers are often the coaches and rule makers.
In 1912, the rules committee made a big change. They made touchdowns worth six points and field goals three. This change was huge. It made teams focus more on scoring touchdowns than field goals.
Today, rule changes like the NFL’s 2024 Dynamic Kickoff rule aim to make the game more exciting. The rule is designed to increase returns and create more scoring chances. It’s all about making the game more thrilling.
But rules are just the start. Coaches are the ones who really make the game exciting. Take John Heisman, for example. He introduced the forward pass, changing the game forever.
Then there’s Chip Kelly, who revolutionized the game with his fast-paced offense. His no-huddle system was all about speed and volume. It made defenses struggle to keep up.
Urban Meyer also made a big impact with his “Spread to Run” philosophy. It used the threat of the pass to open up big lanes for runners. It was a clever way to outsmart defenses.
Today, coaches like Lincoln Riley are pushing the limits even further. They’ve created offenses that are like video game glitches. It’s all about finding new ways to score.
| Catalyst Type | Specific Example | Primary Mechanism | Impact on Scoring |
|---|---|---|---|
| Rule Change (Legislative) | 1912 Point Value Shift (TD: 5→6, FG: 4→3) | Changed fundamental incentive structure | Immediate offensive reorientation toward touchdowns |
| Rule Change (Modern) | NFL 2024 Dynamic Kickoff Rule | Engineers more returns & better field position | Designed to increase scoring drive opportunities |
| Coaching Innovation (Historical) | John Heisman’s Forward Pass Advocacy | Introduced vertical offensive dimension | Broke open static, ground-based defensive schemes |
| Coaching Innovation (Tempo) | Chip Kelly’s Oregon No-Huddle System | Maximized play volume & defensive fatigue | Increased points per game through possession quantity |
| Coaching Innovation (Scheme) | Urban Meyer’s “Spread to Run” at Florida | Used pass threat to create run lanes | Created explosive plays by stressing defensive integrity |
When you see the upward curves in scoring trends over the decades, remember it’s not just about better athletes. It’s about smart decisions in meetings and creative play on the field. The rulebook sets the stage, but coaches make the game exciting.
The game’s progress is not steady. It jumps forward after rule changes or when coaches find the right talent. The scoreboard shows the results, but the real story is told by the rule makers and coaches.
Notable High/Low Scoring Seasons
Forget averages—let’s talk about the statistical unicorns and droughts that define football’s scoring extremes. These seasons aren’t just data points. They’re cultural artifacts. They tell us what was possible, what was valued, and what was downright absurd in their respective eras.
The 1918 Georgia Tech season sits atop the mountain like a scoring Sisyphus who reached the summit. They scored 66.6 points per game. Their scores were like glitches: 118-0, 123-0, 128-0. It was less a football season and more a forensic audit of overmatched opponents.
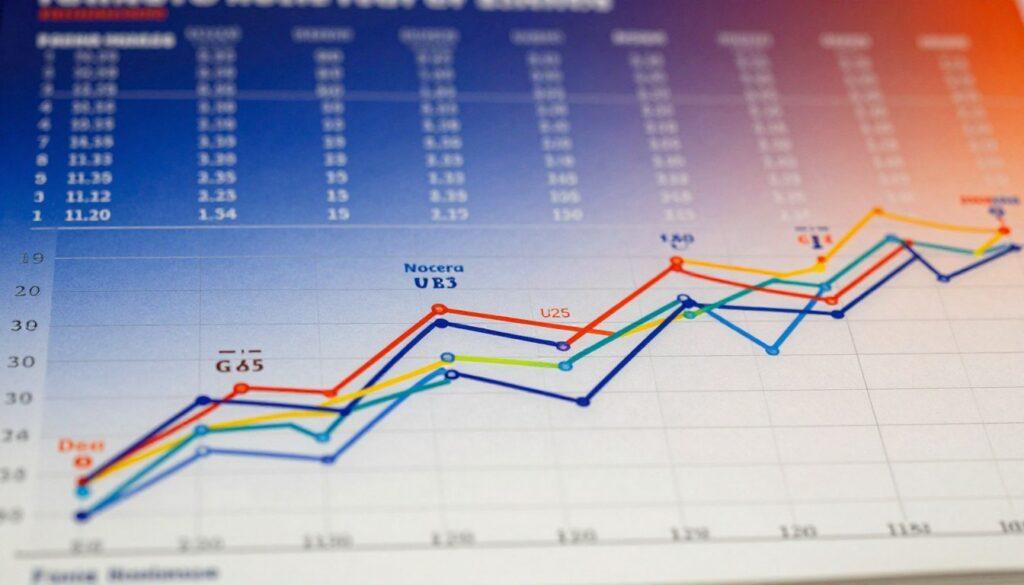
Fast forward through the decades, and the 50-point club remains exclusive. Only 18 teams have ever averaged 50+ PPG for a full season. It’s football’s version of the 27 Club—tragically brilliant and impossible to replicate.
The 1980s gave us two members. The 1983 Nebraska Cornhuskers (50.3 PPG) and the 1989 Houston Cougars (53.5 PPG). These weren’t just run-up-the-score affairs. They were philosophical statements. The wishbone met the Run & Shoot, and defense was merely a suggestion.
The 1995 Nebraska team (53.2 PPG) might be the most complete offensive machine ever assembled. They didn’t just beat you. They demoralized you with a brutal, clock-chewing efficiency that felt inevitable.
Then came the 21st century arms race. 2005 Texas (50.2 PPG). 2008 Oklahoma (51.1 PPG). 2012 Louisiana Tech (51.5 PPG). Each pushed the envelope with spread concepts and quarterback wizardry. The 2013 Baylor Bears (52.4 PPG) didn’t just run an offense. They conducted a seven-second symphony of defensive confusion.
Now, let’s flip the script. The 1933 Fordham Rams “led” the nation with 24.4 points per game. Let that sink in. The highest-scoring team in the country averaged what would get an offensive coordinator fired before halftime today. It’s a sobering reminder of defensive parity and leather-helmet pragmatism.
Where do the Florida football scoring stats slot into this pantheon? Their modern offensive explosions are case studies in scheme evolution. The 2008 Gators didn’t just score. They administered points with surgical precision, a direct product of the spread revolution we dissected earlier.
This contrast creates a fascinating timeline. The lowest-scoring leader from 90 years ago would be a middle-of-the-pack offense today. What does that say about defensive evolution? Or what does it say about our collective surrender to offensive entertainment?
| Season | Team | Points Per Game | Era Context |
|---|---|---|---|
| 1918 | Georgia Tech | 66.6 | Post-WWI, extreme talent disparity |
| 1933 | Fordham | 24.4 | Depression-era, defensive struggle |
| 1983 | Nebraska | 50.3 | Wishbone power football peak |
| 1995 | Nebraska | 53.2 | Option perfection with NFL talent |
| 2008 | Oklahoma | 51.1 | Spread offense revolution in full swing |
| 2013 | Baylor | 52.4 | Modern air raid tempo offense |
Examining Florida football scoring stats through this lens is revealing. Their landmark seasons aren’t just about putting numbers on a board. They’re snapshots of football philosophy at specific moments in time. The Fun ‘n’ Gun wasn’t just a catchy name. It was a declaration of war on defensive convention.
Today’s high-scoring affairs feel different. They’re less about physical domination and more about spatial manipulation. The game has moved from the trenches to the chessboard. And the scores reflect that intellectual shift.
The droughts tell their own story. They remind us that parity, weather, and conservative coaching can halt the offensive machine. Even in today’s score-happy climate, we occasionally get a 6-4 game that feels like a transmission from 1933.
These extremes—the explosions and the famines—bookend our understanding of the sport. They show us what’s possible when everything clicks. And they humble us with what happens when nothing does. The search for balance continues, but the outliers will always be more fun to discuss.
Next-Gen Schemes
The spread offense has taken over. Now, we’re looking at new ways to score. Hybrid systems mix old power with new ideas. They aim to increase points per game using smart strategies.
Analytics are now key in football. AI helps quarterbacks make quick decisions. This change is seen in the NFL’s bold trends, like more fourth-down attempts. It’s about being smart, not just playing more.
Defenses are adapting too. They use new tactics to stop deep passes. It’s a constant battle of innovation. Teams like the Miami Dolphins show how to outsmart defenses.
Scoring now depends on data and strategy. Quarterbacks make decisions based on information. Coaches must be experts in data. The game has become a battle of brains and technology.